
The businesses we are implementing AEO for do not know what Perplexity is. Not in a dismissive way. They have heard the name, they have never opened it, and when I ask what their buyers use to research a purchase, nobody names it.
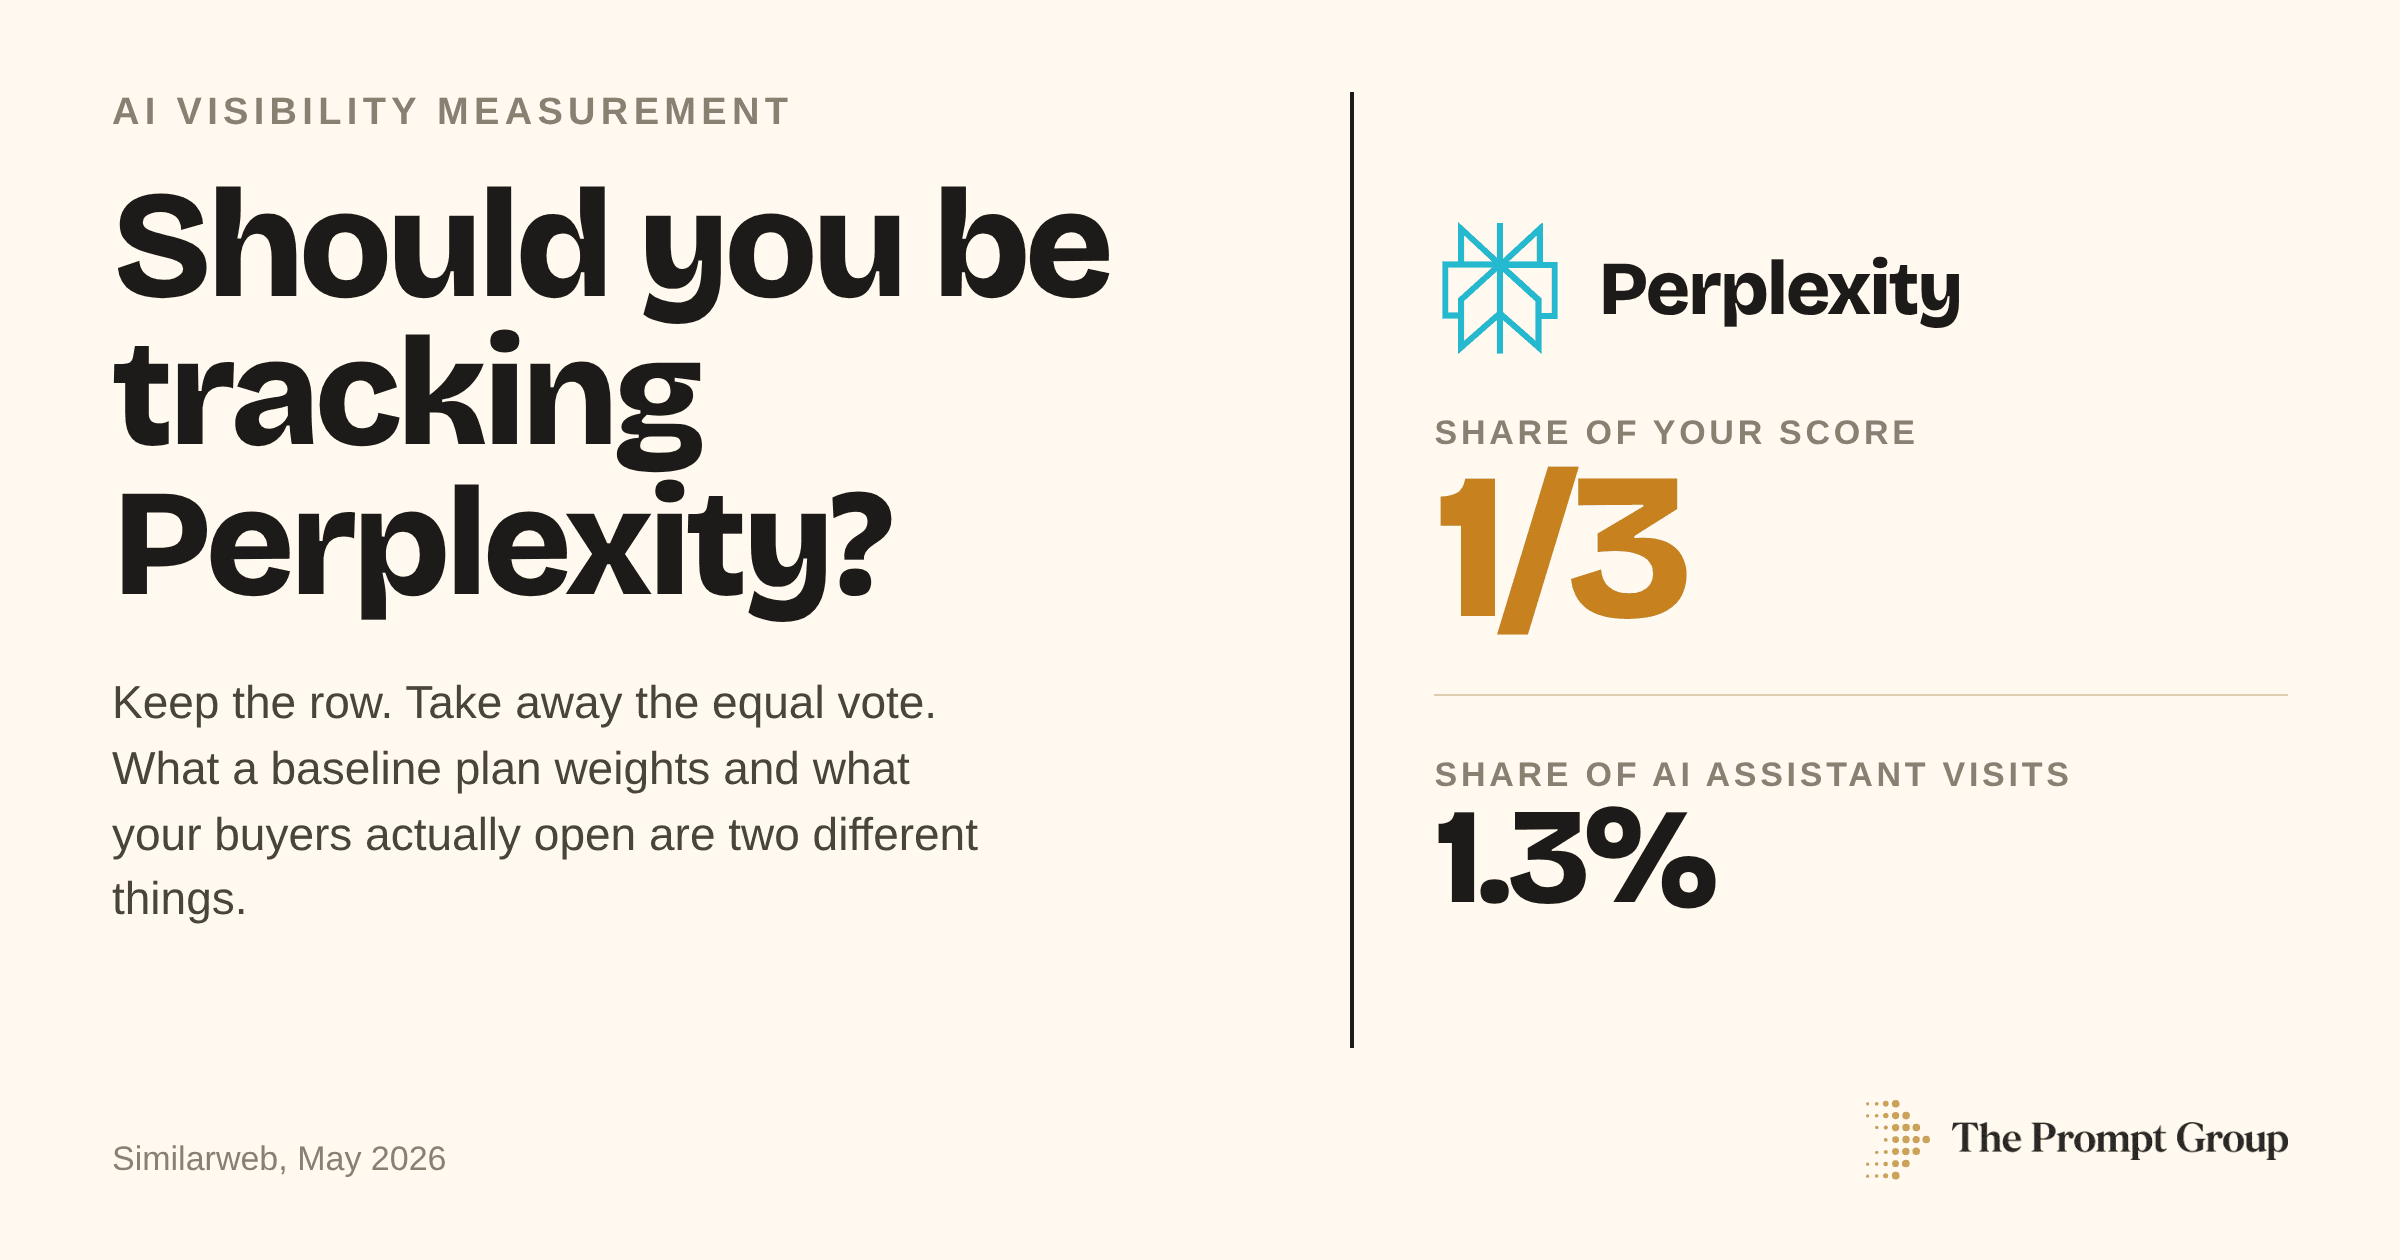
Their AI visibility dashboard disagrees. On most entry tier plans, the tracker follows a small fixed set of platforms and averages them into one composite score. Perplexity is almost always in that set. So a product nobody on the buying committee uses is quietly carrying a third of the number the marketing team reports upward every month.
That is not really a Perplexity problem. It is a weighting problem, and it is the kind that survives for years because nobody made the decision out loud. Averaging feels neutral. Averaging is a weighting decision.
The short answer is yes, keep tracking it, and no, stop letting it count for a third. Below I break down where the one third comes from, what the public usage data says about Perplexity, why your tracker cannot tell you which model wrote the answer it logged, and the three tests that show what your own score looks like without it.
How Much of Your Visibility Score Is Perplexity?
Start with the arithmetic, because the arithmetic is most of the argument. AI visibility tools sell tiers by platform coverage. The baseline tier includes a small fixed set, commonly three, and the headline score is an unweighted average across them. In the plans I have reviewed, Perplexity is nearly always one of the three.
Which means Perplexity gets the same vote as ChatGPT. One third of the score, one third of the movement, one third of the trend line your CMO looks at on Monday morning.
Now ask what would justify that. Equal weighting is defensible in two situations: when the platforms are used about equally by the people who buy from you, or when you have no information at all about who uses what. Neither one is true here. The usage data is public, and it is not close.
Tracked platform | Share of your composite score | Share of AI assistant web visits |
|---|---|---|
ChatGPT | One third | 53.9 percent |
Gemini | One third | 27.9 percent |
Perplexity | One third | 1.3 percent |
Read the two right hand columns together. One of them is a product decision your vendor made about how to package plans. The other one is behaviour.

Do Your Buyers Actually Use Perplexity?
Similarweb figures for May 2026, cited by Greg Jarboe in Search Engine Journal in September 2026, put ChatGPT at 53.9 percent of web visits among AI assistants, Gemini at 27.9 percent and Claude at 9.2 percent. Perplexity came in at 1.3 percent, level with Microsoft Copilot.
1.3% of web visits among AI assistants went to Perplexity in May 2026, level with Microsoft Copilot
Referral data tells a similar story with more volatility. StatCounter's worldwide AI chatbot referral share, reported in the same piece, has Perplexity moving from 7.91 percent in June 2026 to 4.31 percent in August 2026, while Gemini went the other way over the same window, from 7.94 percent to 10.9 percent.
Two different measurement methods, two different absolute numbers, one consistent shape. Perplexity is a small share of how people reach AI answers, and on the referral measure it is a shrinking one. It is being averaged as an equal.

This gap widens in B2B rather than narrowing. Aggregate assistant usage counts everybody asking for a dinner recipe. The buying committee you sell to is a much narrower population, and the assistant in front of them is usually the one their employer already pays for, which means Microsoft or Google, or the one they installed for themselves, which means ChatGPT. Coverage is not usage.
If you want the reweighted version of your score before it goes in front of a board, see how we handle platform weighting in AI brand tracking.
Is Perplexity a Model or an Interface?
Here is the part that breaks comparability outright, and it gets almost no attention in this debate.
Perplexity does not have one model behind it. Its own help centre lists selectable models from OpenAI, Google, Anthropic, xAI, Moonshot AI, Z.ai and NVIDIA, alongside Perplexity's own Sonar. The documentation tells subscribers to leave the setting on Best, which, in Perplexity's words, picks a suitable model for each query so you do not have to.
So when your tracker logs a Perplexity answer, one of three things happened. The user was on Perplexity's own model. The user had manually selected a third party model. Or the router chose one for that specific query, and nobody wrote down which.

Your ChatGPT row measures one system. Your Perplexity row measures a dispatcher standing in front of several systems, one of which is the system in your ChatGPT row. A surface is not a peer of a system.
It also means your Perplexity score can move without anything changing about your brand. A routing change on Perplexity's side, a model added to or dropped from the pool, a shift in what Best selects for commercial queries, and a third of your composite moves. You will read that as a result. It was a configuration change.
Why Is Perplexity on Every Baseline Plan?
None of this is news to the tool vendors, so the interesting question is why the default persists. The honest answer is structural rather than sinister. Three things make Perplexity the cheapest platform in the category to include.
Access is easy. Perplexity is built around a documented API and a search product that expects programmatic use. Pulling answers at volume is a solved engineering problem there, which is not true of several surfaces your buyers genuinely use.
Cost per query is low. Coverage is priced in queries. A platform that answers cheaply lets a vendor promise more prompts, more refresh frequency and more locations at the same margin.
It is one more logo on the coverage page. Platform count is how buyers compare these tools. Four logos beats three in a side by side, whether or not the fourth logo changes a single decision anyone makes.
Set that against Google AI Overviews, which by the figures in the same Search Engine Journal piece reached roughly 2.5 billion monthly users as of June 2026 and appeared in 43 percent of US searches in May 2026. Much harder to collect at scale, far more consequential to a buyer, and on plenty of plans it sits behind an upgrade.
So the platforms on your baseline plan are not ranked by influence over your pipeline. They are ranked by how easy they are to instrument. Cheap to track is not the same as worth tracking.
If you want a platform list built from your own closed deals rather than a plan tier, start with how we scope AI brand tracking.
How Do You Test This on Your Own Dashboard?
You do not need a new tool to fix this. You need to decompose the score you are already paying for. Three tests, in order, and none of them takes more than an afternoon.
1. Would Your Ideal Customer Profile Use Perplexity at All?
Not whether Perplexity is a good product. Whether the person who signs your contract would open it to answer this specific question. Ask your last ten closed deals what they used. Pull your own referral logs and break assistant traffic out by source. If Perplexity appears in neither answer, you are holding evidence rather than an opinion, and it took two days to get.
Where your category sits on the delegation curve changes how much this matters. In a purchase the buyer delegates almost entirely, the platform they used decides nearly everything, because inclusion in the first answer is the whole game. In a considered purchase settled three questions later, which platform they started on matters less than what the answers went on to say about you.
That second problem is a different measurement question, and we have written it up separately.
2. What Happens to Your Score If You Strip It Out?
Export the platform level data and rebuild the composite without Perplexity. Most tools will show you per platform scores even when they report only the average.
Whatever the gap turns out to be, that gap is the portion of your headline number that one platform was carrying, and you should know its size before anyone treats the headline as a baseline. A small gap retires the worry cheaply. A large one tells you the trend line you have been reporting upward was mostly a story about a platform your buyers do not open.
3. Which Cited Sources Only Rank Because of Perplexity?
This is the test that changes what you do next week, and it is the one people skip.
Every visibility tool also reports which sources the models cited. Pull that list twice, once across all tracked platforms and once with Perplexity excluded, then compare the rankings. Any domain that falls several positions when you remove one platform out of three was a platform artefact, not a category signal.
That matters because the source list is the part of the dashboard teams turn into actual work. A domain in the top five becomes an outreach target, a guest post, a review profile to claim, a quarter of somebody's time. If it ranked there on the strength of the platform contributing least to your pipeline, you have handed your content roadmap to the wrong sample.
Source level reads move around far more than a composite average suggests, which is why we publish them per category. Our study of which cybersecurity providers AI recommends in Canada is a worked example of reading a market by who actually gets cited rather than by an averaged score.
Should You Delete Perplexity or Just De-Weight It?
The strongest version of the opposing case deserves stating properly, because the fix here is easy to overshoot.
Ross Hudgens argued for pulling Perplexity out of AI visibility trackers altogether. Greg Jarboe, writing in Search Engine Journal, disagreed and drew the distinction I think is the right one: do not remove Perplexity from your tracker, remove it from the position of equal weighting. He sorts the market into three tiers, with ChatGPT, Gemini and Claude tracked separately, Google AI Overviews, AI Mode and Copilot as the ecosystem embedded tier, and Perplexity, Grok and DeepSeek monitored but not weighted as equals.
Two good reasons to keep the row. Perplexity is genuinely used in some categories, developer tooling and research heavy B2B among them, and if yours is one of those, the data is real and you should act on it. And a platform with a small share today can grow, which is exactly what Claude did over the past year, going from barely 2 percent of assistant visits to close to 9 percent on Similarweb's numbers.
Jarboe's line about the last era transfers cleanly. The mistake was never tracking too many search engines. The mistake was assuming that today's market leaders would still be tomorrow's.
So keep measuring it. Stop letting it vote. Track it as a signal you check quarterly, not as a third of a number you report monthly.
